Our Novel Electrical Detection Technology
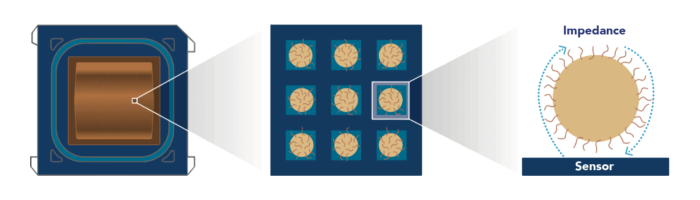
On the surface of the CMOS sequencing chip, there are millions of sensors, each designed to capture one clonally amplified bead. Every sensor consists of electrodes in close proximity to each other which contact the bead captured by that sensor. These sensors are tuned to detect minute changes in impedance modulation between the electrodes. Since nucleotide incorporation into a growing DNA strand increases the amount of charged molecules around the bead, it changes the impedance measured by the sensor. The magnitude of the impedance change is correlated to the total change in the charge of DNA molecules and their surrounding layers around the bead, which is correlated to the number of incorporated nucleotides.
Steady state electrical signal increases signal-to-noise ratio for greater base-calling accuracy.
Electronic Sequencing By Synthesis


The plot below contains a representative example of acquired data showing the distribution of measured differential signal across multiple nucleotide flows for a single template sequence. Flows that are expected to have nucleotide incorporations are highlighted in red. Non-incorporating flows are shown in blue and do not deviate significantly from the baseline. The inferred sequence, including the number of nucleotides in each incorporation are shown below.